
Search Analytics for Team Administrators
Search Analytics helps you understand what your team is looking for via browser search, and whether they find something useful.
You can see popular search phrases, searches that found little or nothing, who is searching the most, and which presentations people open after they search. That makes it easier to spot missing materials, confusing titles, or topics your team cares about.
Who can use this page? Team administrators. Everyday team members do not see Search Analytics in the menu. Mobile Locker staff can open it after switching into a team.
New as of July 21, 2026
- Search Analytics is not retroactive. We only record searches and opens from search starting when this feature launched. There is no history from before that date. If you pick a date range that starts earlier, you will only see activity from the launch date onward.
- For now, only browser search is included. Search on iOS and Windows will be added later.
On this page
How to open Search Analytics
- Sign in to Mobile Locker admin.
- In the left menu, open Reporting.
- Click Search Analytics.
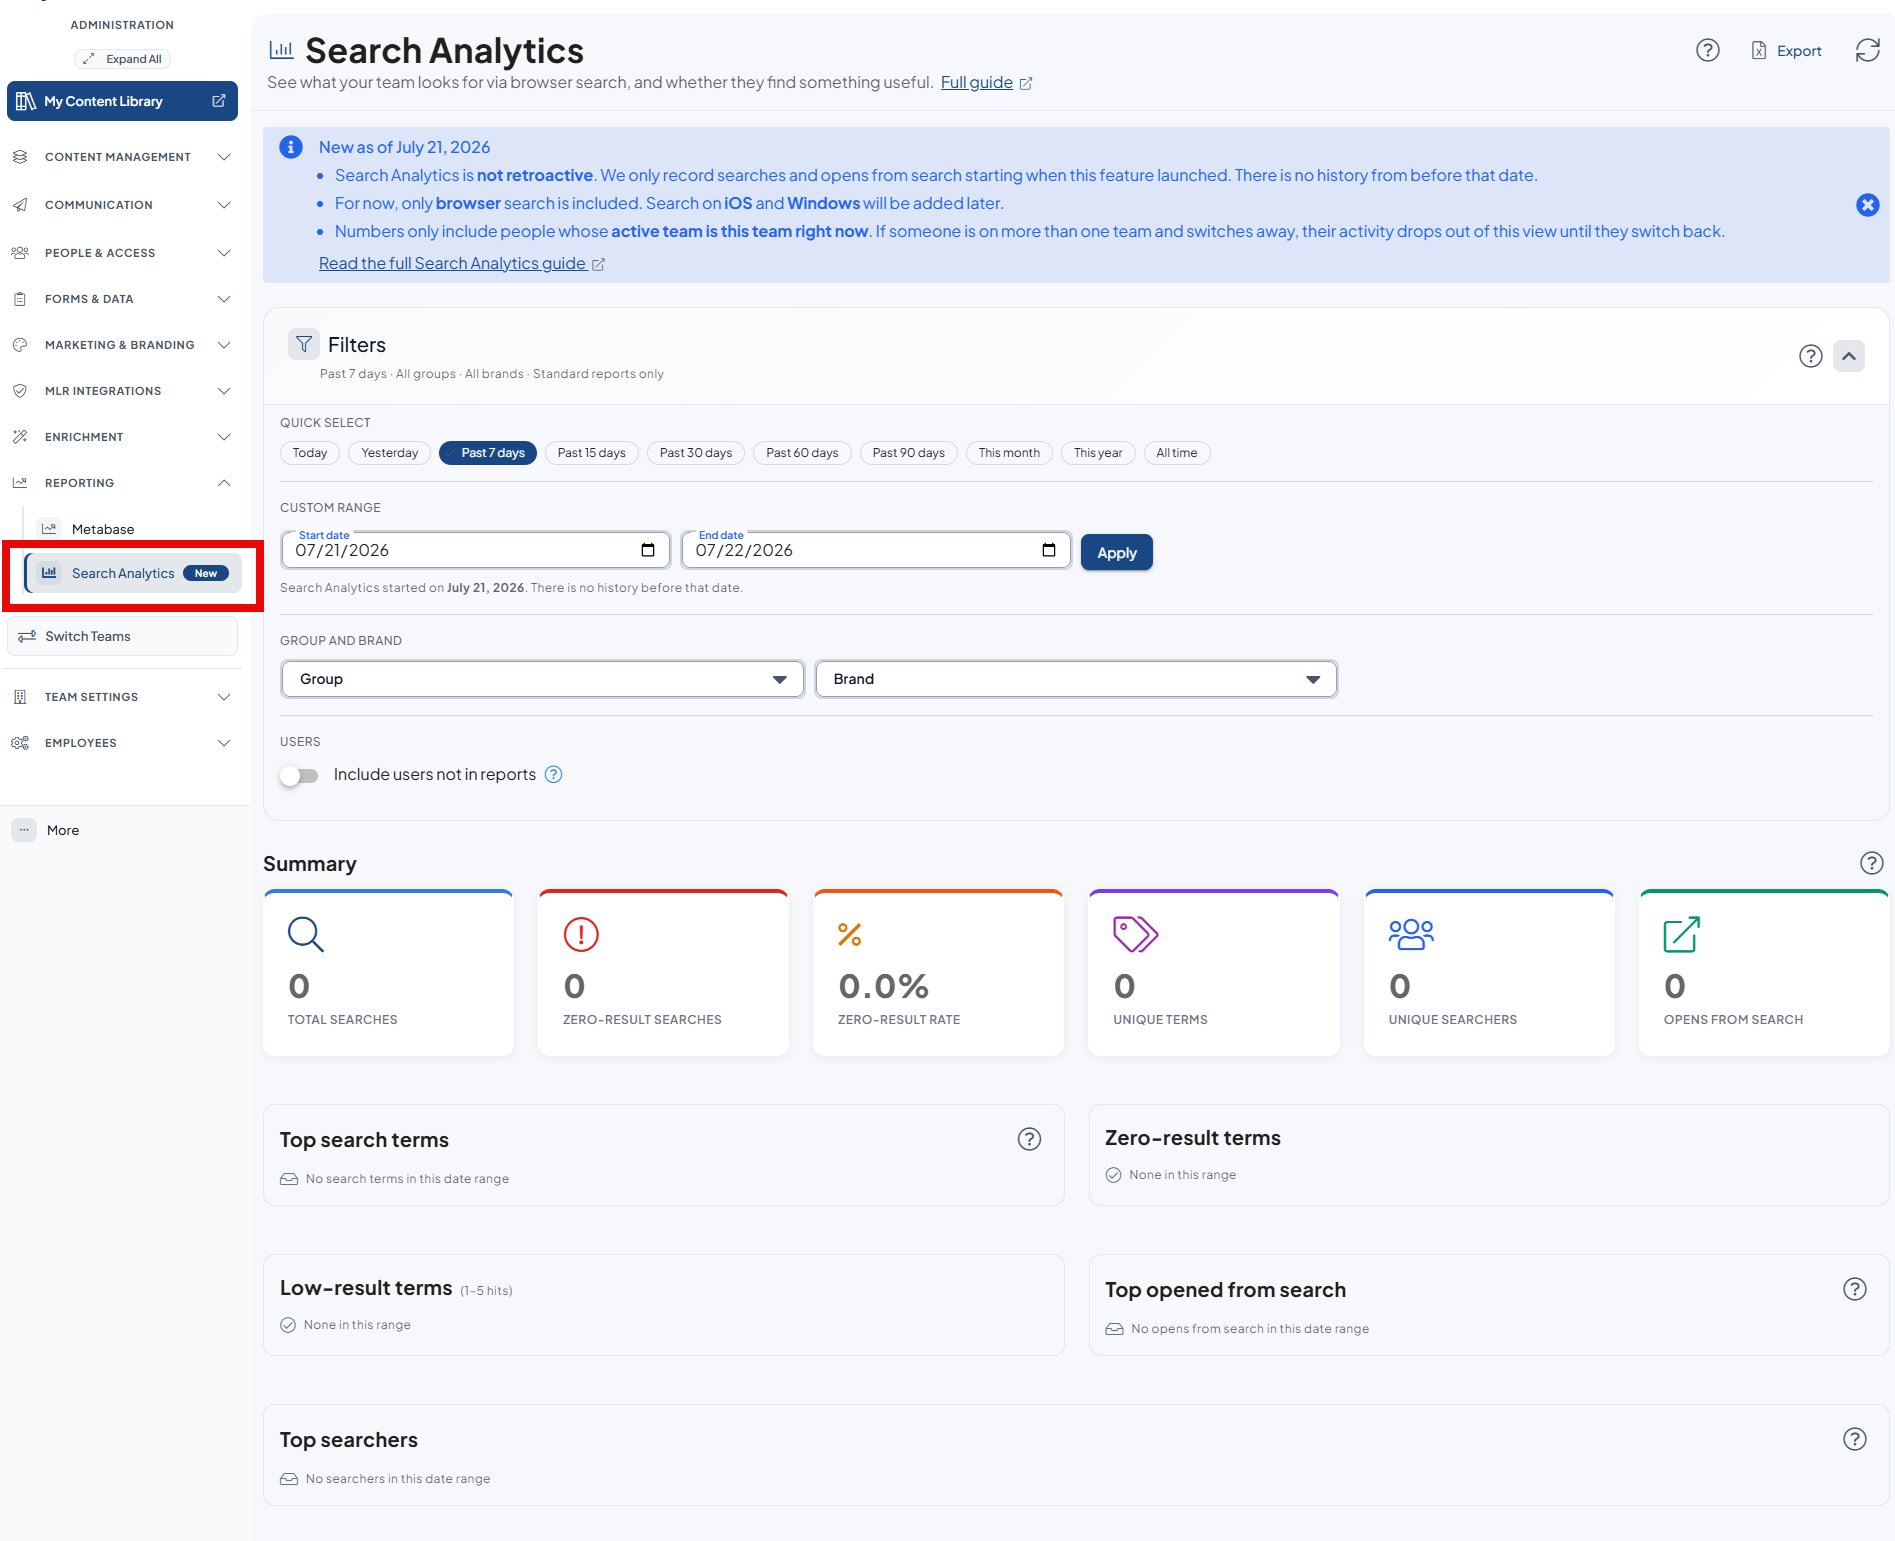
Everything on the page is for the team you currently have selected. To look at another team, use Switch Teams first, then open Search Analytics again.
People on more than one team
Only people whose active team is this team right now are included in the numbers. If someone belongs to several teams and switches away from yours, their searches for this team no longer appear in your dashboard until they switch back. That keeps each team’s view focused on people currently working in that team.
Throughout the page, small ? buttons open short explanations of each section. You can also click a search phrase, a person, or a presentation to open a side panel with more detail.
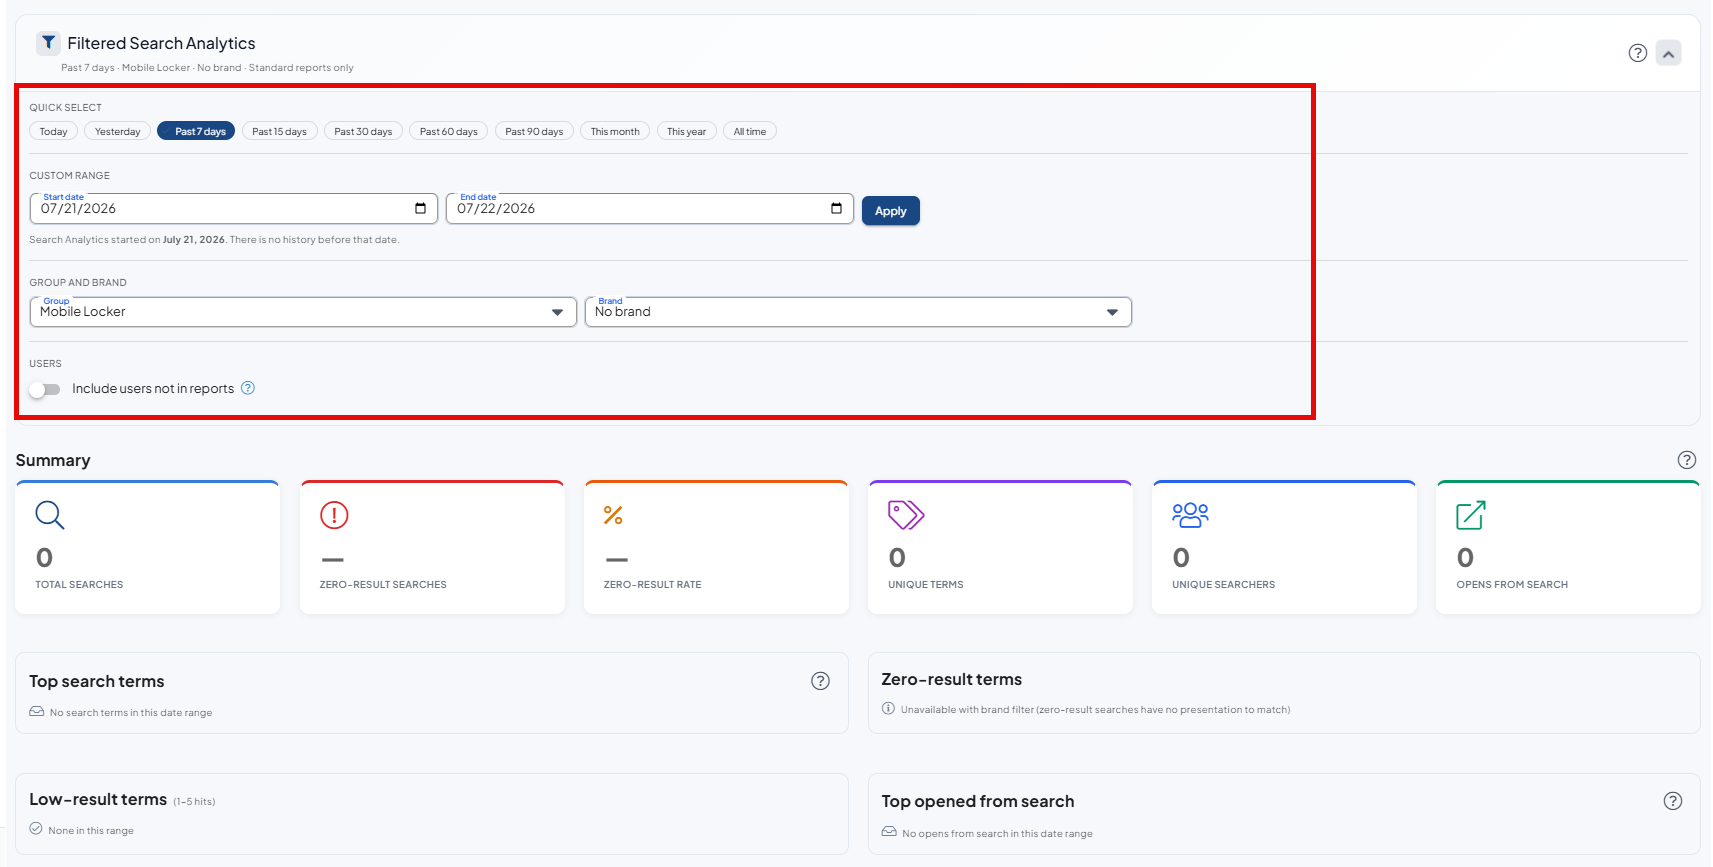
Filters
Filters control which activity is included in every card, chart, and table on the page, including the side panels when you dig into a phrase, a person, or a presentation.
Click the Filters header to collapse or expand the panel. When collapsed, the header still shows a short summary of your date range, group, brand, and user setting so you can see what is applied without opening the panel again.
Date range
Use the quick select buttons, or set your own start and end dates under Custom range and click Apply. The page defaults to Since launch so you are not looking at empty days before recording began.
Under Custom range, the page always notes that Search Analytics started on July 21, 2026 and that there is no history before that date. You cannot pick a start date earlier than the launch day.
| Option | What you get |
|---|---|
| Since launch | From July 21, 2026 (when Search Analytics started recording) through today. This is the default. |
| Past 7 / 15 / 30 / 60 / 90 days | From that many days ago through today (never earlier than the July 21, 2026 launch). |
| This month / This year | From the start of the current month or year through today |
| All time | From the later of your team creation date or the feature launch date, through today |
| Custom range | Any start and end dates from launch day forward (click Apply). A short note under the dates reminds you that there is no history before July 21, 2026. If the range is longer than 366 days, the start date is moved forward so you keep the most recent 366 days (with a short notice on the page). |
| Since launch / All time (when history is long) | These presets also stay within 366 days once the full period would exceed that limit—so the page keeps working without an error. |
Group (optional)
Choose a group to limit the page to people who are members of that group. A person can be in more than one group; they are included if they belong to the group you pick.
Leave the group blank to include everyone (subject to the other filters).
Brand (optional)
Choose a brand when you want to focus on one product line or brand of content:
- Opens from search only count when someone opened a presentation of that brand.
- Searches only count when the search results included at least one presentation of that brand.
Searches that found nothing cannot be tied to a brand, so they will not appear when a brand filter is selected. On the summary cards, zero-result counts show as a dash (—) while a brand is selected for the same reason.
Leave brand blank for all brands and unbranded presentations. Choose No brand to see only activity for presentations that are not assigned to any brand.
Include users not in reports
Some people are left out of normal team reports—most often team administrators. Mobile Locker staff who briefly join a team for training or support may also be excluded; they sometimes run a few searches while helping. On Search Analytics you can choose:
- Off (the default): only people who are included in your standard reports.
- On: also include people who are normally left out of reports (for example team admins, or Mobile Locker staff during training or support).
Export to Excel
Use Export next to the page title (beside refresh and help) to download a single Excel workbook (.xlsx) of what you currently see on the page. The file uses your active filters—date range, group, brand, and include users not in reports.
The workbook is built for sharing with non-technical teammates. It includes:
- Summary — Mobile Locker branding, your team name, when the file was generated, the filters you applied, and the same key metrics as the summary cards. The Summary sheet also includes a link back to this help article so anyone who receives the file can learn how to read the numbers.
- Volume — daily search and open counts
- Top terms, Zero-result terms, and Low-result terms
- Top opens and Top searchers
Each list is limited to the same top rows as the dashboard (not a full history of every search). Side-panel drill-downs (one phrase, one person, or one presentation) are not included in the export.
Tip: Set your filters, click Apply so the cards and tables update, then click Export. Export uses the filters that produced the dashboard you see—if you change filters without applying, Export stays disabled until you apply. If someone opens only one sheet, the blue title band still shows the sheet name and date range so the snapshot stays understandable. On quiet days with no searches, the Summary sheet says so clearly, and empty tables show a short “no data” message instead of blank grids.
Summary cards
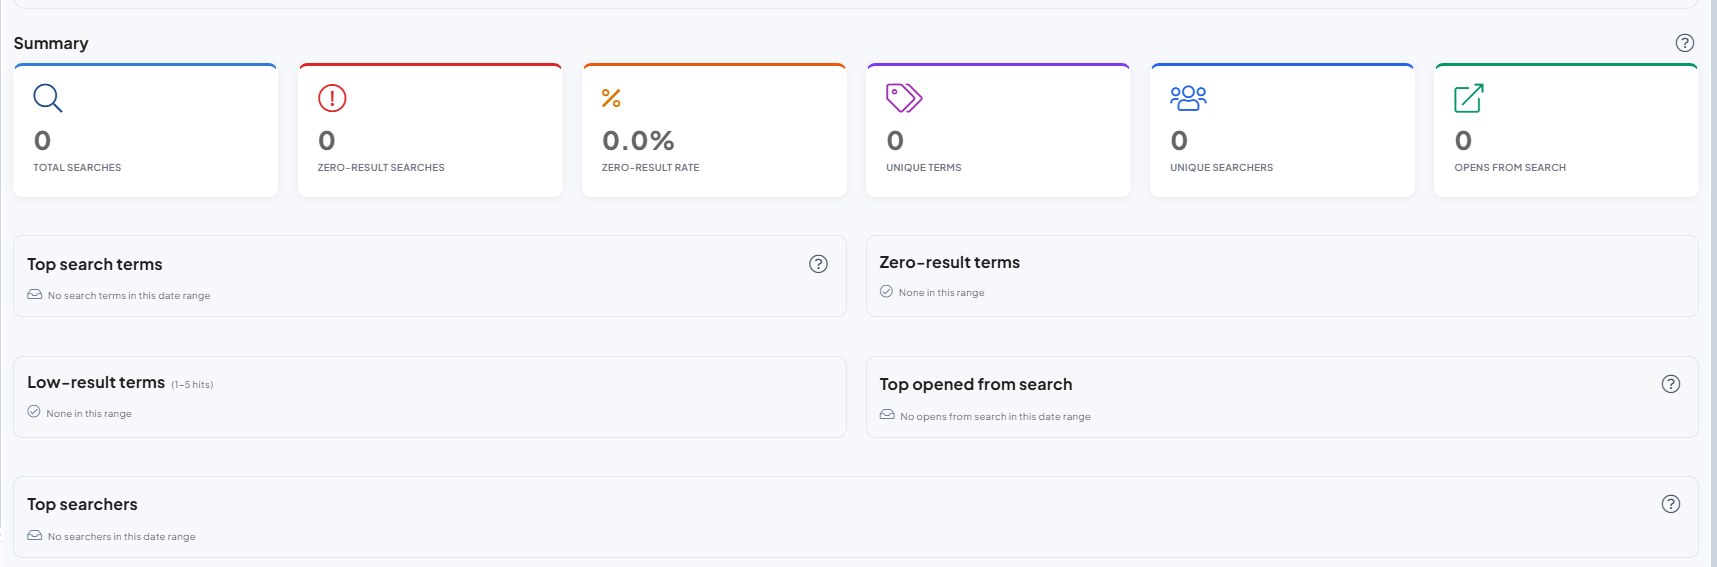
The cards near the top are a quick snapshot for your filters:
| Card | What it means |
|---|---|
| Total searches | How many times someone searched for presentations |
| Zero-result searches | Searches that found no presentations |
| Zero-result rate | What share of searches came up empty |
| Unique terms | How many different phrases people used |
| Unique searchers | How many different people searched |
| Opens from search | How many times someone opened a presentation from the search results |
Search volume chart
When you have activity on at least two different days, a chart shows searches and opens from search by day. That helps you spot busy periods (for example after a launch or training) or quiet stretches. Points stay visible on the lines so quiet days are easy to see.
If almost all activity is on a single day, the chart is hidden. The summary cards and tables are enough for that case.
Search term tables
Three lists show the phrases people typed. Small differences in capitalization are grouped so the same idea is not split into many rows.
| Table | Why it matters |
|---|---|
| Top search terms | What people look for most often, and roughly how many results they usually get |
| Zero-result terms | Phrases that found nothing. Often a sign you need new content or clearer titles |
| Low-result terms | Phrases that only found a few presentations (about 1-5). Possible thin coverage or hard-to-find materials |
Last seen on the empty and low-result lists is the most recent time someone searched that phrase in your date range.
Tip: Click any phrase to open a side panel of who on your team searched for it (name, email, how many times, and when they last searched it). Click a person in that panel to see their full search activity.

Top opened from search
This list ranks presentations by how often they were opened from search results, not every time someone opens a file from a folder or favorites. Use it to see which content search is actually delivering.
Click a presentation name to open a side panel with:
- A short summary (opens, how many different people, how many different search phrases)
- When it was last opened from search, shown under the title
- Who opened it: people who opened this presentation from search (click a name for that person's activity)
- Search terms that led here: phrases people had searched when they opened this presentation (click a phrase to see who searched it)
- Admin: opens the presentation's settings and content in admin (in a new tab)
Top searchers
Top searchers ranks people by how often they searched in your date range. You can see empty-result counts, how many different phrases they tried, opens from search, and when they last searched.
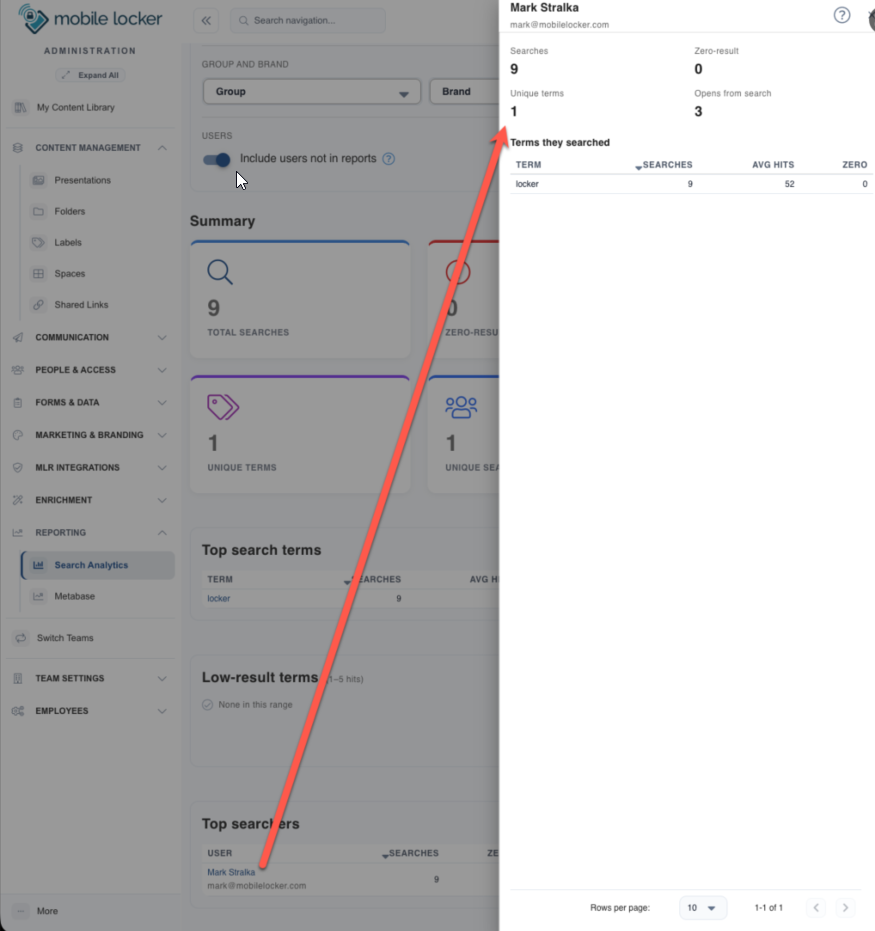
Click a person's name to open a side panel with:
- A short summary for that person (and when they last searched)
- Terms they searched: phrases and how often (click a phrase to see who else searched it)
- Recent searches: what they typed and how many results came back
- Opened from search: presentations they opened after searching (click a name for that presentation's panel)
Side panels
When you click a phrase, a person, or a presentation, a panel slides in from the right with more detail. Only one of these panels is open at a time, so the page stays easy to follow. Closing the panel or clicking something else returns you to the main page view.
Each panel shows the date range you selected, so the numbers stay aligned with the filters at the top of the page.
What this page does not include
- Search history from before Search Analytics launched (July 21, 2026)
- Simple name filters in the content UI that never run a full search
- Searching for contacts or other non-presentation items
- Search on iOS or Windows (coming later)
- Technical search system tools for Mobile Locker staff (those live under a different menu)
Ideas for getting value quickly
- Start with zero-result and low-result terms. Those usually point to content people need but cannot find.
- If many people search but few open anything from search, the results may not match what they expect.
- Use Group or Brand when you want a narrower view (for example one sales team or one product line).
- Leave Include users not in reports off for numbers closer to other team reports; turn it on only when you need team admins (or, less often, training/support activity) included too.
- Click through from a presentation to see who opened it and which phrases led them there. That often reveals naming gaps more clearly than the main tables alone.
- If your company uses Metabase (also under Reporting when enabled), your Mobile Locker contact can help with deeper custom reports.